Your OpenRMF® Dashboard
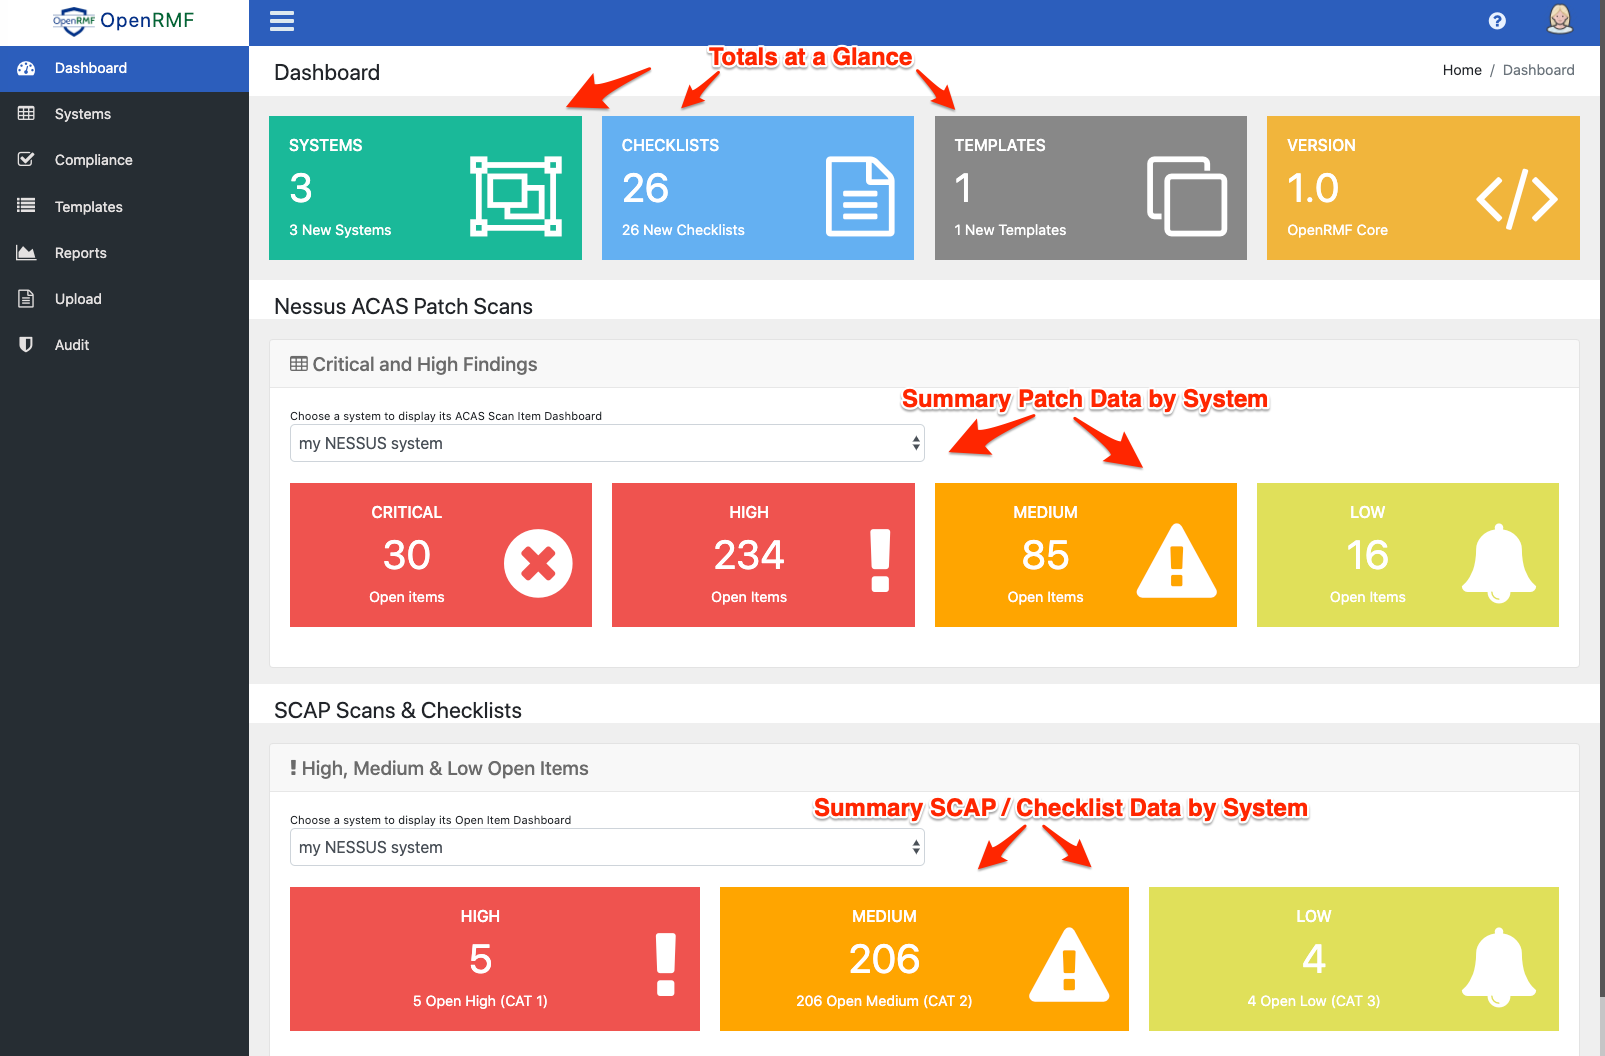
The initial OpenRMF® dashboard shows the total checklists, total systems, and total templates within the system at the very top of the page. Underneath that are two sections: one for Nessus / ACAS Patch scan data and one for Checklist open vulnerability data.
The Critical and High Findings allow you to select a system (independently from other sections on this page) and see the numbers for Critical, High, and Medium severity items. You can export the summary data of the Nessus file on the System page itself. This dashboard just gives you the high level numbers by system.
If there is no Nessus scan file uploaded, the dashboard will notify you of that as well. You must have a Nessus patch scan file (
*.nessus) loaded for this to work for your system.
The SCAP Scans & Checklists area allows you to quickly see the total number of High, Medium, and Low open items across all your checklists for the system selected. Click on any of these to go to the System to view all items, checklists, and system level data.
Future enhancements will allow setting of items on the dashboard to your liking as well as show alerts, status, dates, and valid user information.