Using Prometheus and Grafana for OpenRMF® Metrics
OpenRMF® tracks metrics used by Prometheus. We currently use the https://github.com/prometheus-net/prometheus-net component for the .NET Core Web APIs and the https://github.com/nats-io/prometheus-nats-exporter container for exporting NATS 2.0 metrics out to a Prometheus endpoint. With that information, you can setup the below Grafana dashboards to show usage, memory, requests, errors, and the like.
The docker-compose file for running OpenRMF® locally uses a container definition for Prometheus and Grafana locally. The Kubernetes deployment does not. For Kubernetes you can hook to your existing Prometheus and Grafana setup. Or you can deploy separately to namespaces within Kubernetes and then setup the data sources there.
For now you have to initially setup the Grafana dashboards. Starting with version 0.14 we use a volume to store the data correctly so you can set it and forget it.
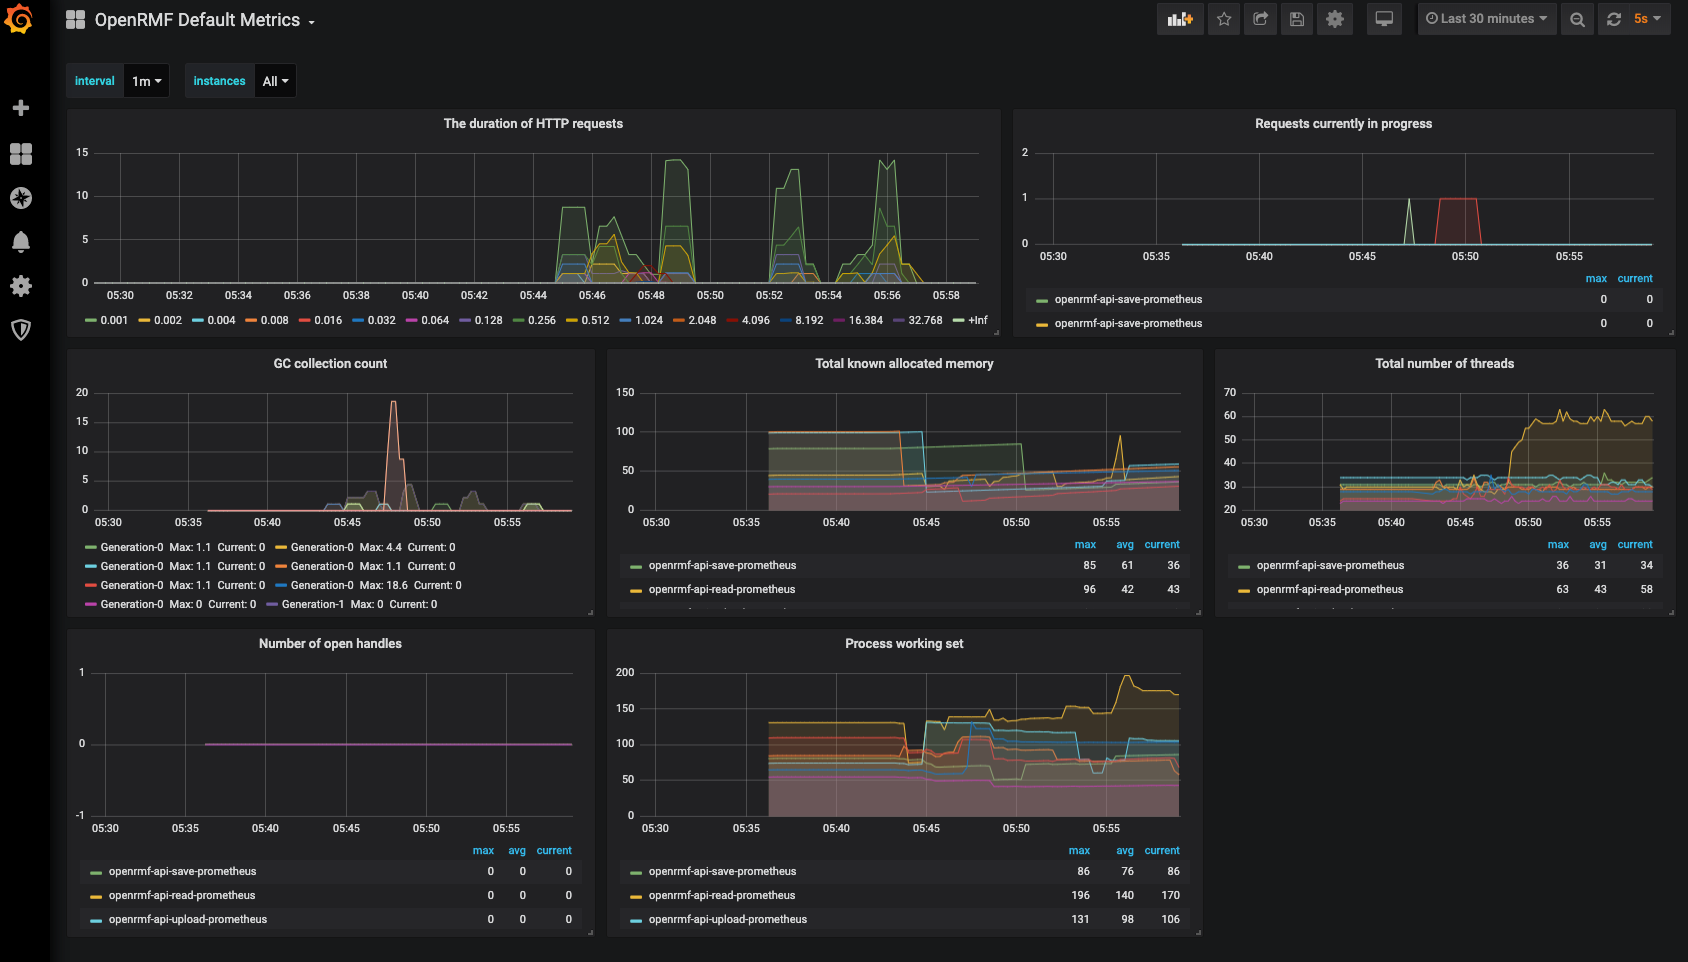
.NET Core Default Metrics
Once you have Prometheus setup, you can use the https://grafana.com/grafana/dashboards/10427 to display .NET Core metrics like the below chart.
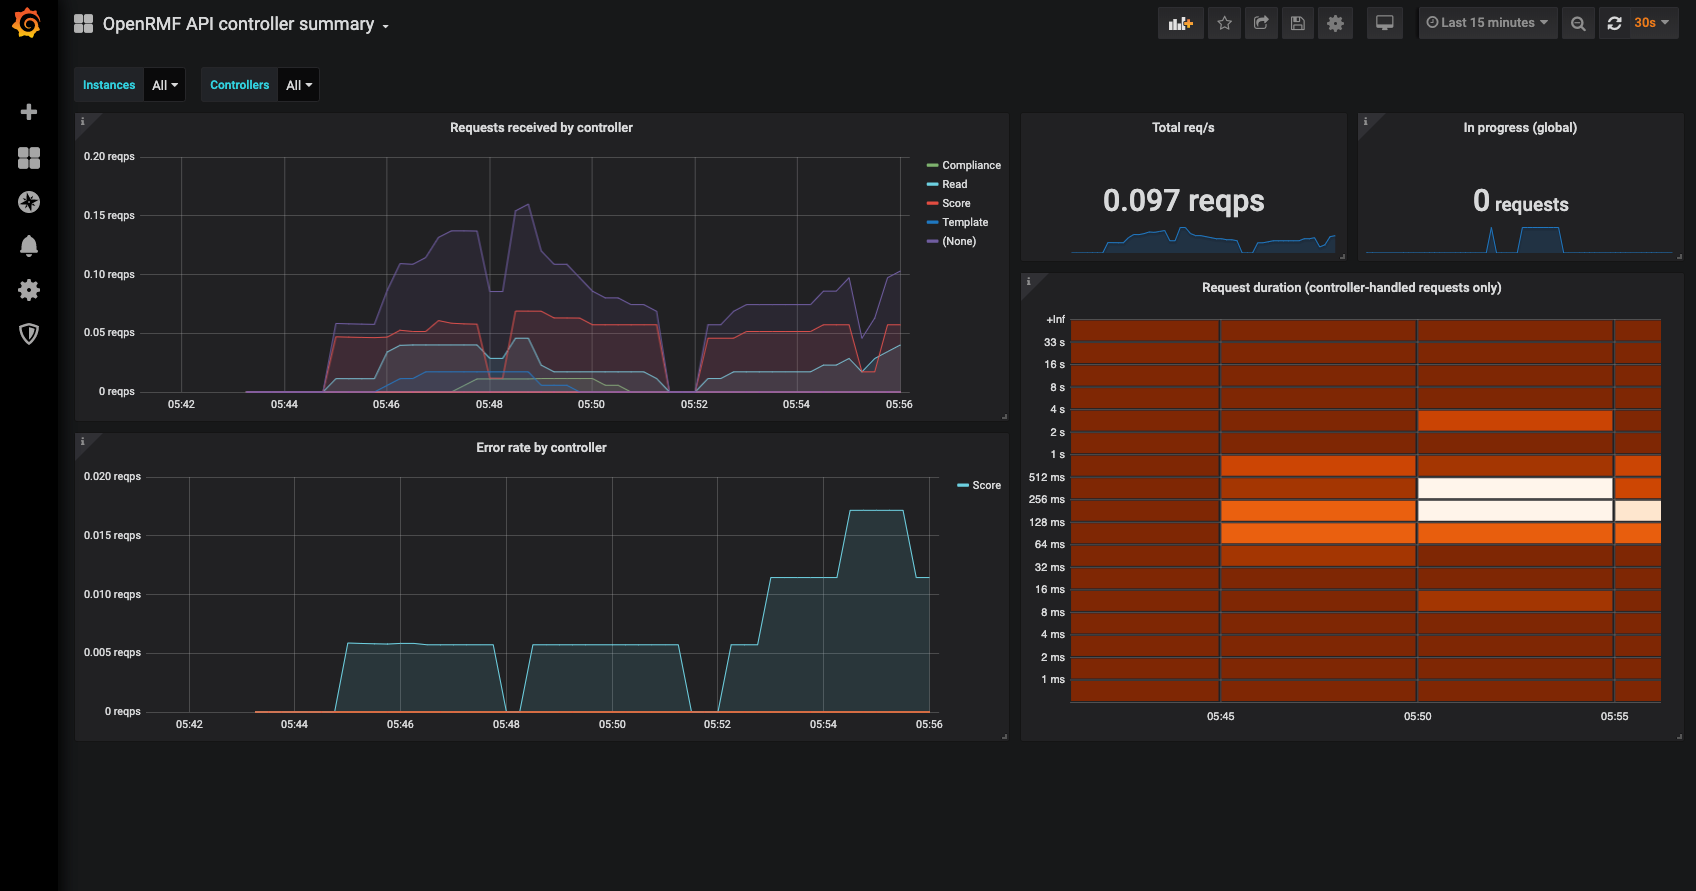
.NET Core API Controller Metrics
Once you have Prometheus setup, you can use the https://grafana.com/grafana/dashboards/10915 to display .NET Core metrics like the below chart.
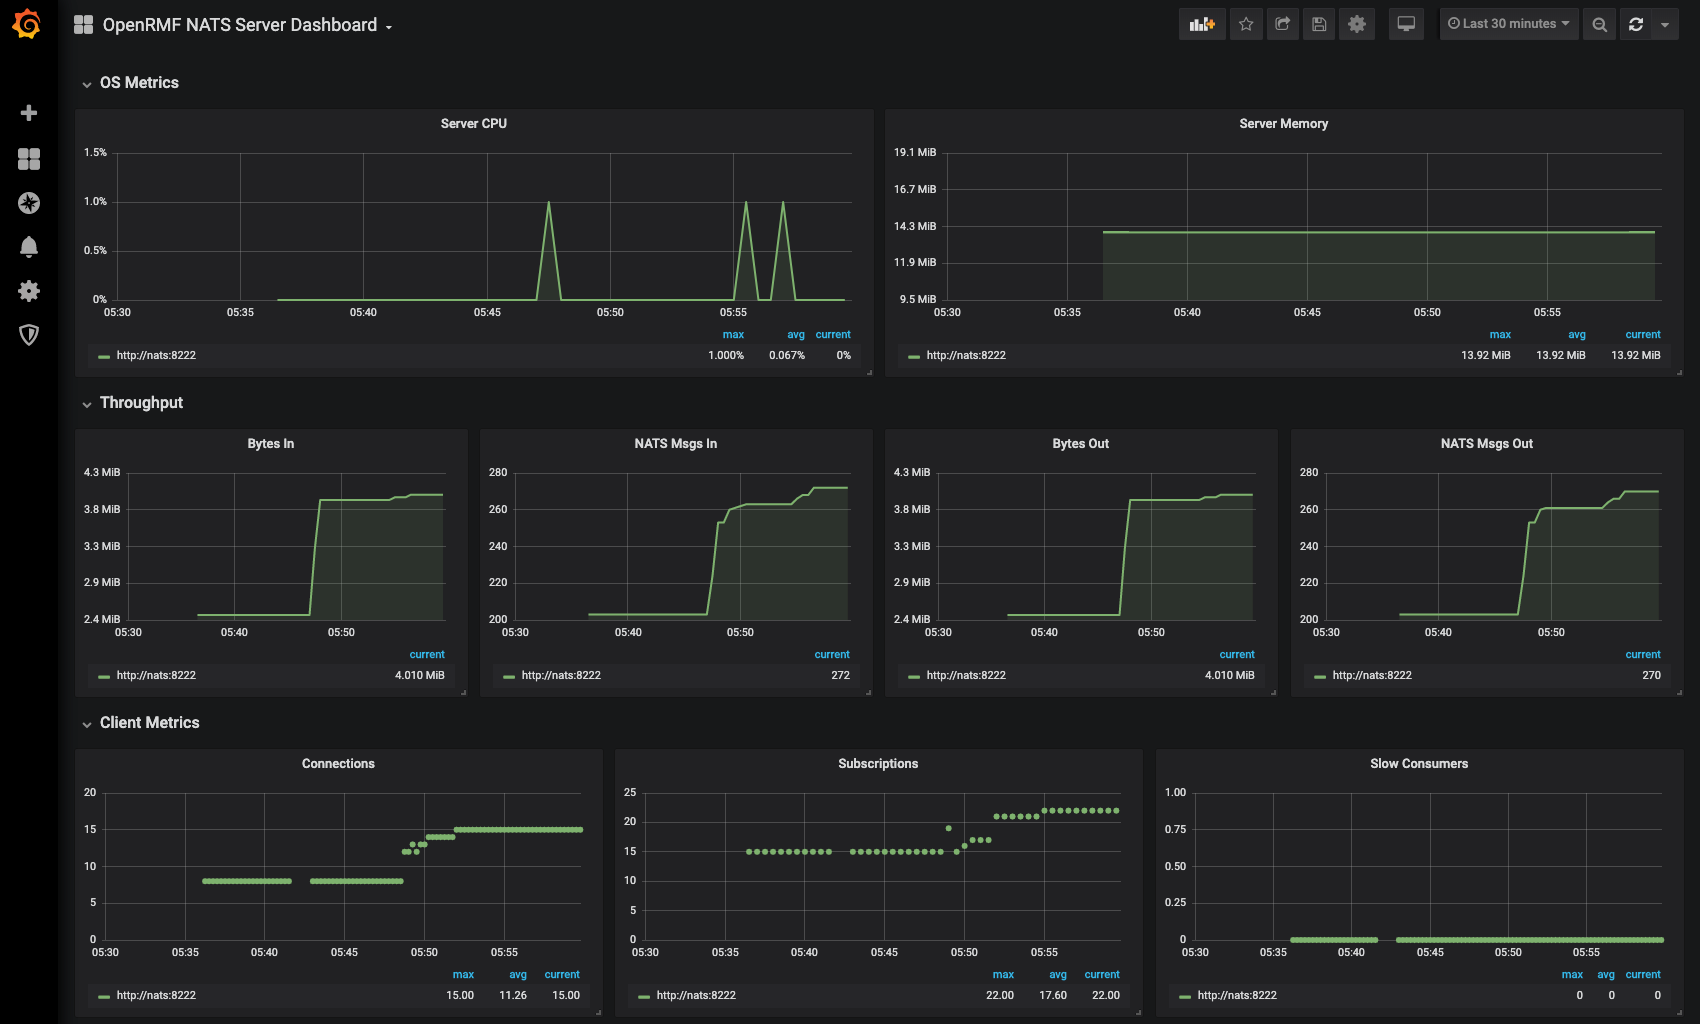
NATS Server Metrics
Once you have Prometheus setup and you deploy the container for https://github.com/nats-io/prometheus-nats-exporter, you can use the https://grafana.com/grafana/dashboards/2279 to display NATS Server Core metrics like the below chart.
NATS Client Connection Metrics
I made a NATS metrics dashboard at https://github.com/Cingulara/nats-client-metrics that goes down to the client level. The default NATS dashboard for Grafana keeps everything at a server level for bytes in and out, messages in and out, etc. I wanted per client. So go to that URL above and add that dashboard referenced in the JSON file to your Prometheus if you want NATS client metrics.
Web Interface Metrics
There is also an NGINX default dashboard in the included dashboards with Grafana packaged with OpenRMF® v1.7 and beyond as well. That will show activity for the user interace of the application.
Prometheus Configuration Setup
The prometheus.yml file configuration we use when running the local or docker-compose setup of OpenRMF® is here. You can adjust the interval and options as required. Just restart the docker-compose up -d command to relaunch and use the new configuration.
See the OpenRMF Metrics in GitHub information to understand how we use those tools within OpenRMF®.
Additional Links
Prometheus: https://prometheus.io/docs/prometheus/latest/querying/basics/
Grafana: https://grafana.com/